

How strong are your e-commerce ops? Take the 2-min scorecard.
Score Your OpsTraffic without conversion is expensive noise. You are paying for ads, optimizing listings, running campaigns — and somewhere between the first click and the completed purchase, buyers are disappearing. A conversion audit finds exactly where they leave and why.
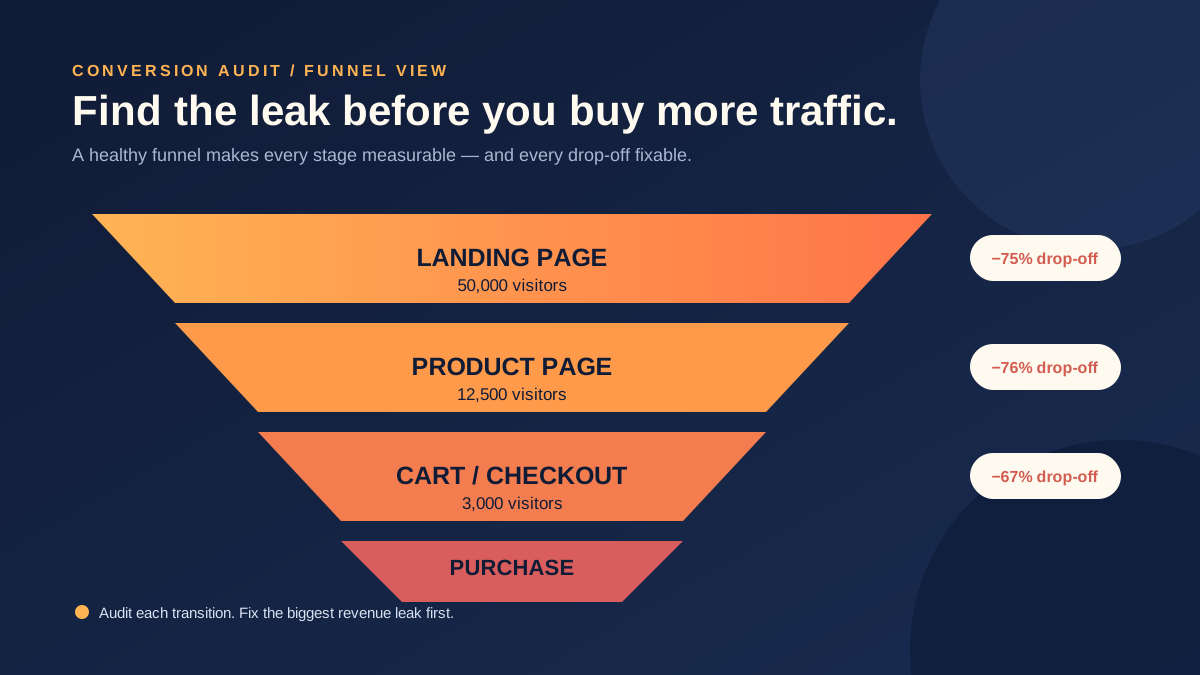
Most ecommerce teams treat conversion rate as a single number. "Our conversion rate is 2.3%." That number hides everything. It hides the product page that converts at 0.4%. The checkout step where 35% of buyers abandon. The mobile experience that loads three seconds slower than desktop. The trust signal that is missing on your highest-traffic landing page.
An ecommerce conversion audit breaks the buyer journey into stages, measures each one, identifies the leaks, and gives you a prioritized fix list. This guide covers the full audit process — from product pages to checkout to post-purchase — with the specific checks, benchmarks, and fixes that matter for multi-channel ecommerce sellers.
What Is an Ecommerce Conversion Audit?
An ecommerce conversion audit is a systematic review of every stage in the buyer journey — from landing page to order confirmation — to identify where potential customers drop off and why.
A conversion audit is not a redesign project. It is a diagnostic exercise. You are not changing your store based on opinions. You are measuring what happens at each step, comparing it to benchmarks, and fixing the gaps with the highest revenue impact.
The audit covers four areas:
- Product pages — Where most buying decisions happen
- Checkout flow — Where most abandonment happens
- Trust signals — Where most hesitation happens
- Mobile experience — Where most traffic comes from
Each area has specific metrics, benchmarks, and audit checks. You do not need to fix everything. You need to find the 2-3 biggest leaks and fix those first.
Why Does Your Ecommerce Store Need a Conversion Audit?
Because a 0.5% improvement in conversion rate at your current traffic level generates more revenue than a 20% increase in traffic — at zero additional ad spend.
The math is straightforward. If your store gets 50,000 visitors per month with a 2% conversion rate and $80 average order value, you generate $80,000 per month. Improving conversion to 2.5% — the same traffic, same AOV — generates $100,000. That is $20,000 per month from fixing what you already have.
Compare that to the cost of acquiring 20% more traffic through paid channels. At a $2 CPC, that is an additional $20,000 in ad spend — for the same $20,000 in revenue. The conversion audit pays for itself in the first month.
For multi-channel sellers, the impact multiplies. Conversion improvements on your Shopify store compound with improvements on Shopee, Lazada, and TikTok Shop. A better product image does not just help one channel — it helps every channel that displays it.
How Do You Audit Product Pages?
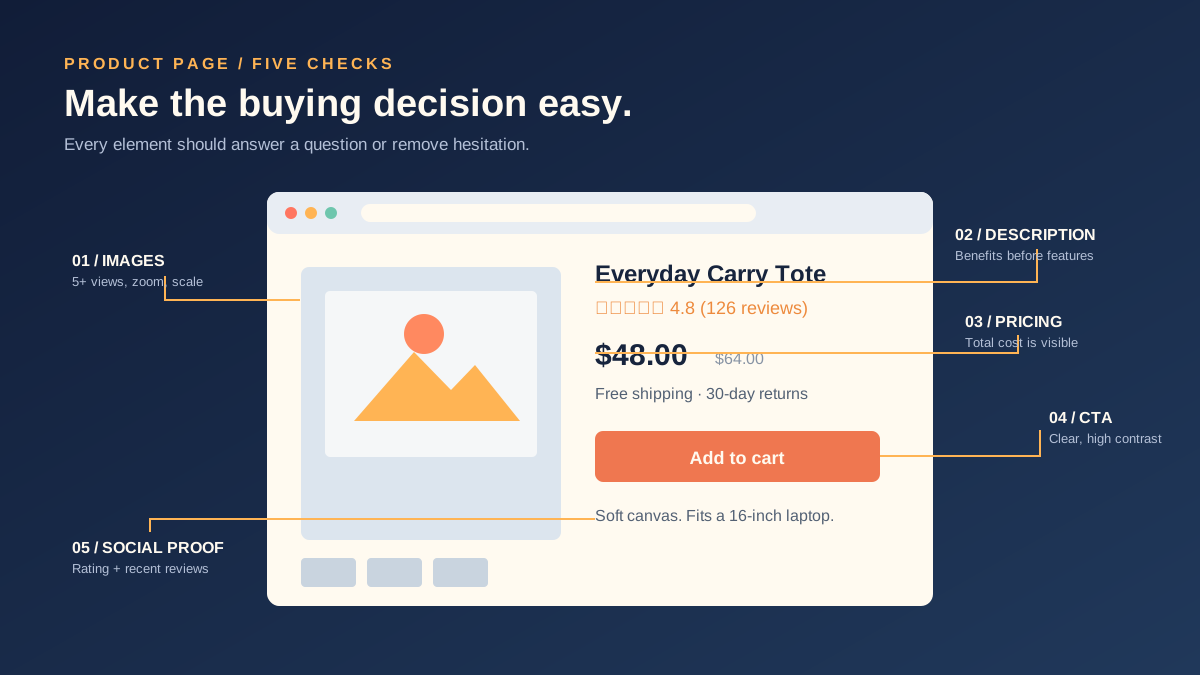
Product page audits check five elements: images, description, pricing display, social proof, and call-to-action clarity — each measured against conversion benchmarks.
The product page is where the buying decision happens. A visitor who reaches your product page has intent. Your job is to remove every barrier between that intent and the "Add to Cart" button.
Images
| Check | Benchmark | Common Failure |
|---|---|---|
| Number of product images | 5+ images | Only 1-2 images uploaded |
| Image resolution | 1000x1000px minimum | Low-res images from manufacturer |
| White background main image | Required for marketplaces | Lifestyle shot as main image |
| Lifestyle/context images | At least 2 | All images on white background |
| Zoom functionality | Works on mobile and desktop | Zoom broken or missing on mobile |
| Video | At least 1 product video | No video content |
| Size/scale reference | Included in at least 1 image | No size context for the product |
What to fix first: If you have fewer than 5 images per product, adding images is the single highest-impact change you can make. Products with 5+ images convert 30-50% higher than products with 1-2 images across every marketplace.
Description
Check for: benefit-first structure (not feature-first), scannable formatting (bullets, headers), answer to the top 3 buyer objections, specific measurements and specifications, clear "what's in the box" section.
The most common description failure: copying manufacturer text. Every competitor selling the same product has the same description. Your product page looks identical to theirs, and the buyer has no reason to choose you.
What to fix first: Rewrite your top 20 products (by traffic) with unique descriptions that lead with benefits, address objections, and include specifications that help the buyer decide.
Pricing Display
Check for: visible price without scrolling, clear comparison if on sale (original price with strikethrough), shipping cost displayed before checkout (not surprises at payment), bundle/quantity pricing visible if applicable.
What to fix first: If shipping cost is not visible on the product page, add it. Unexpected shipping costs at checkout are the number one reason for cart abandonment — Baymard Institute research consistently shows this.
Social Proof
Check for: review count visible on product page, average rating displayed, review content accessible without leaving the page, recent reviews (within 90 days), photo reviews included.
What to fix first: If you have reviews but they are not prominently displayed, move them above the fold on mobile. On desktop, ensure the review count is visible near the product title.
Call-to-Action
Check for: "Add to Cart" button visible without scrolling on all devices, button color contrasts with page background, button text is specific (not just "Submit"), secondary CTA for comparison shoppers ("Add to Wishlist," "Compare").
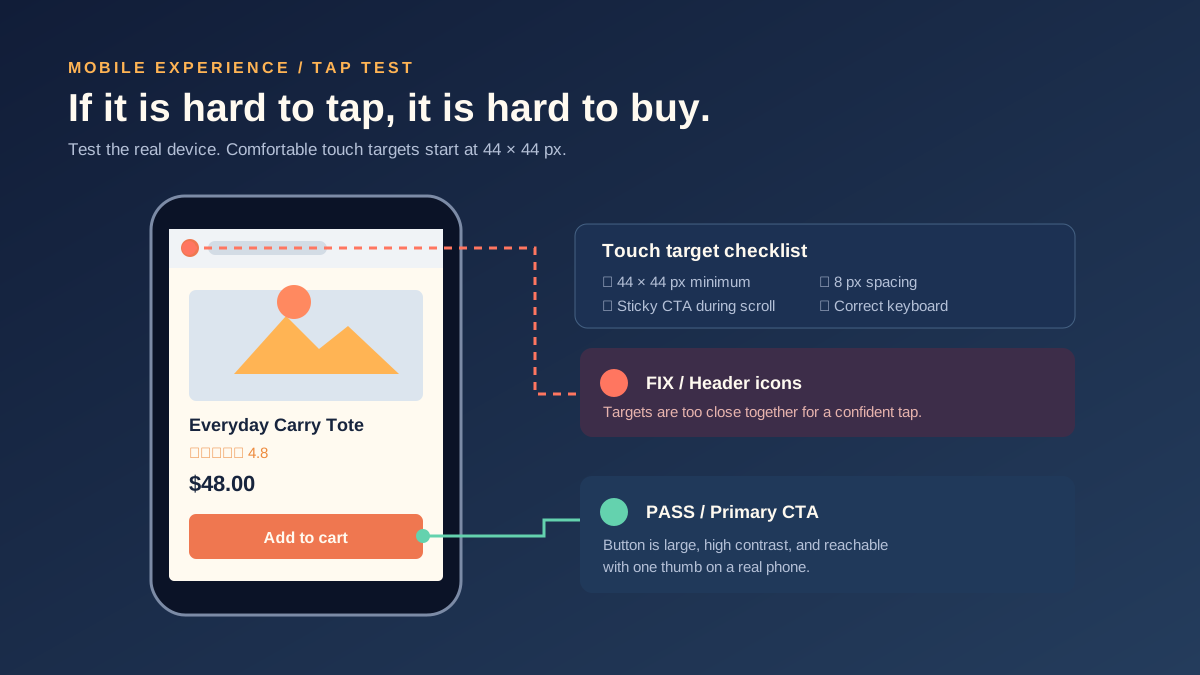
What to fix first: Open your product page on a phone. If you cannot see the "Add to Cart" button without scrolling, your mobile conversion rate is suffering.
How Do You Audit the Checkout Flow?
Checkout audits measure abandonment rate at each step, identify friction points, and benchmark against the industry standard of 3-4 steps to purchase.
Checkout is where you lose the most money. The global average cart abandonment rate is approximately 70%. That means 7 out of 10 people who add a product to their cart do not complete the purchase.
Step-by-Step Checkout Audit
| Checkout Element | What to Check | Benchmark |
|---|---|---|
| Number of steps | Count pages/screens from cart to confirmation | 3-4 steps maximum |
| Guest checkout available | Can buyers purchase without creating an account | Must be available |
| Form fields | Count required fields | 7-8 fields maximum |
| Payment options | Number and type of payment methods | 3+ including digital wallets |
| Error handling | What happens when a field is invalid | Inline error next to field, not page-level |
| Progress indicator | Can the buyer see how many steps remain | Visible progress bar |
| Mobile keyboard | Do phone fields show number pad, email fields show @ | Correct input types set |
| Auto-fill support | Do fields accept browser auto-fill | Autocomplete attributes present |
| Cart persistence | Does the cart survive page close/device switch | Cart saved for 7+ days |
| Security indicators | Are SSL badge and payment security visible | Visible at payment step |
How to measure checkout abandonment per step:
Set up funnel tracking in your analytics tool. For Shopify, use the built-in checkout analytics. For marketplaces, review the conversion data in each Seller Centre. You want to know: what percentage of buyers who start checkout complete it, and where exactly they drop.
The three most common checkout leaks:
-
Mandatory account creation. Forcing registration before purchase adds friction. Always offer guest checkout. Offer account creation after purchase when the buyer is already committed.
-
Surprise costs. Shipping, tax, or handling fees that appear for the first time at checkout trigger abandonment. Show total cost as early as possible — ideally on the product page.
-
Too many form fields. Every additional field reduces completion rate. Remove optional fields. Combine first and last name into a single field. Use address auto-complete to reduce typing.
How Do You Audit Trust Signals?
Trust signal audits verify that your store provides enough credible evidence — reviews, security badges, policies, and contact information — for a first-time buyer to feel safe purchasing.
Trust signals matter most for first-time visitors who have never bought from you before. Repeat customers already trust you. But repeat customers start as first-time buyers, and if your trust signals are weak, they never become repeat customers.
Trust Signal Checklist
| Signal | Where It Should Appear | Status |
|---|---|---|
| SSL certificate (HTTPS) | Every page | Must have |
| Payment security badges | Checkout page, footer | Must have |
| Return policy | Product page, footer, checkout | Must have |
| Shipping policy | Product page, checkout | Must have |
| Customer reviews | Product page | Must have |
| Contact information | Header, footer, contact page | Must have |
| Physical address | Footer, contact page | Recommended |
| Social media presence | Header or footer links | Recommended |
| Media mentions/press | Homepage or about page | Nice to have |
| Guarantee/warranty | Product page | Nice to have |
For marketplace sellers: Trust signals work differently on Shopee, Lazada, and TikTok Shop. Your seller rating, response rate, and shipping speed are your trust signals. Buyers on marketplaces check your seller metrics before purchasing. A 4.8-star rating with 1,000+ reviews carries more weight than any badge.
This is why seller health monitoring matters — your marketplace trust signals are directly tied to your operational metrics.
How strong are your ecommerce operations? Score your ops in 2 minutes — Take the free scorecard. No signup required.
How Do You Audit the Mobile Experience?
Mobile audits test page speed, touch target sizes, form usability, and the complete purchase flow on actual devices — not just responsive design in a browser simulator.
Mobile accounts for 60-75% of ecommerce traffic in Southeast Asia and continues to grow globally. If your mobile experience is even slightly worse than desktop, you are losing the majority of your potential conversions.
Mobile Audit Checklist
| Check | How to Test | Target |
|---|---|---|
| Page load speed | Google PageSpeed Insights | Under 3 seconds on 4G |
| Largest Contentful Paint | PageSpeed Insights | Under 2.5 seconds |
| Touch target size | Manual test on phone | Minimum 44x44 pixels |
| Text readability | Manual test without zooming | 16px minimum body text |
| Image loading | Scroll through product page on 4G | Images load within scroll speed |
| Form field usability | Complete checkout on phone | All fields accessible, correct keyboards |
| Sticky CTA | Check product page on phone | Add to Cart visible during scroll |
| Pop-ups/overlays | Browse on phone | No overlays blocking content on mobile |
| Search functionality | Search for a product on phone | Results appear fast, filter works |
| Navigation | Browse categories on phone | Max 2 taps to reach any product |
The most impactful mobile fix: Page speed. If your mobile page loads in 5 seconds instead of 2 seconds, you lose approximately 30% of visitors before they even see your product. Compress images, lazy-load below-fold content, and minimize JavaScript. This single fix often generates more revenue than any design change.
Testing on actual devices matters. Browser developer tools simulate screen size but not actual device performance. A page that looks fine in Chrome DevTools may lag on a mid-range Android phone — which is what most buyers in Southeast Asia use. Test on real devices.
How Do You Prioritize Conversion Fixes?
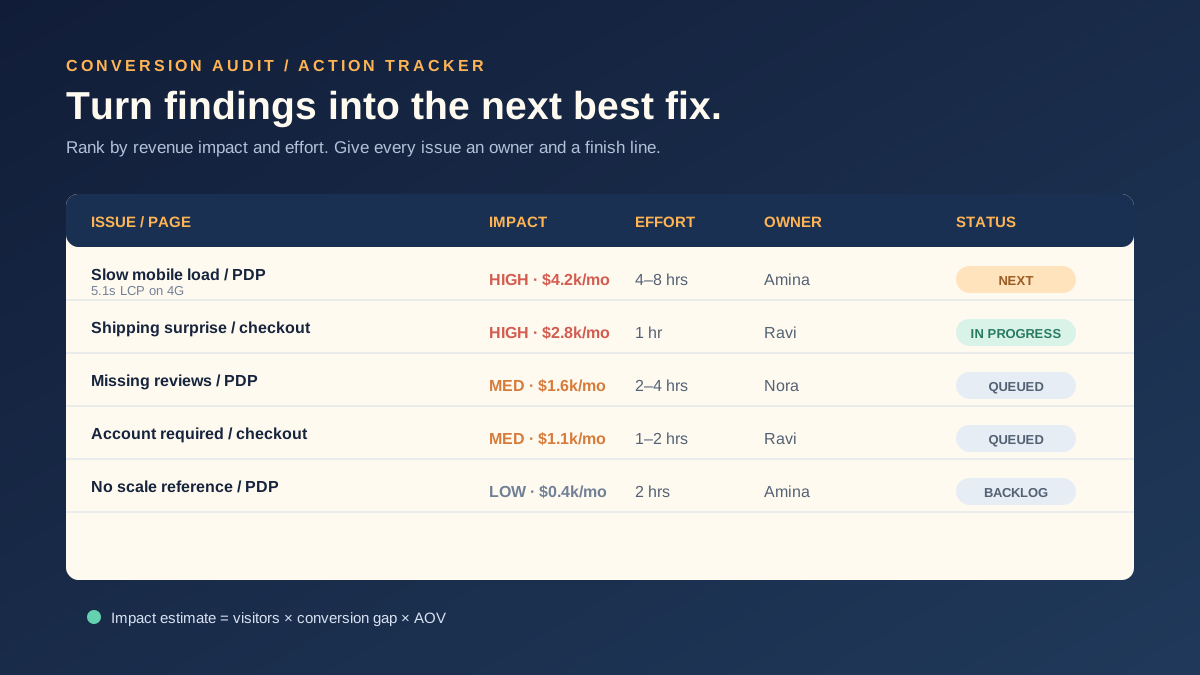
Prioritize by potential revenue impact: calculate the revenue lift if each page or step improved to benchmark, and fix the highest-value items first.
After completing the audit, you will have a list of issues. Do not try to fix everything at once. Prioritize using this framework:
Revenue Impact Formula: Revenue Lift = (Current Visitors to Page) x (Benchmark Conversion Rate - Current Conversion Rate) x (Average Order Value)
Example: Your top product page gets 5,000 visitors per month and converts at 1.5%. The benchmark for your category is 3%. AOV is $60.
Revenue Lift = 5,000 x (0.03 - 0.015) x $60 = $4,500/month
If fixing the product page images and description costs 8 hours of work, that is a clear priority.
Priority Matrix
| Fix Category | Typical Effort | Typical Revenue Impact | Priority |
|---|---|---|---|
| Page speed optimization | 4-8 hours | High (affects all pages) | 1 |
| Add missing product images | 2-4 hours per product | High (30-50% conversion lift) | 2 |
| Enable guest checkout | 1-2 hours | High (reduces checkout abandonment 15-25%) | 3 |
| Display shipping costs on product page | 1 hour | Medium-High (reduces cart abandonment) | 4 |
| Rewrite top 20 product descriptions | 20-40 hours | Medium (10-20% conversion lift per product) | 5 |
| Add review display to product pages | 2-4 hours | Medium (builds trust) | 6 |
| Mobile CTA optimization | 1-2 hours | Medium (improves mobile conversion) | 7 |
| Reduce checkout form fields | 2-4 hours | Medium (reduces checkout abandonment) | 8 |
How Do You Run a Conversion Audit Across Multiple Channels?
Each channel requires a separate audit with channel-specific benchmarks — your Shopify store, Shopee shop, Lazada store, and TikTok Shop each have different conversion drivers.
Multi-channel sellers cannot run one audit and apply it everywhere. The conversion levers differ by platform:
Shopify (your own store): You control everything. Page speed, checkout flow, trust signals, and design are all within your power. This is where a full conversion audit has maximum impact because you can change anything.
Shopee: You control listing quality, pricing, vouchers, and customer chat response. You do not control checkout flow, page layout, or payment options. Focus your audit on listing images, title optimization, pricing competitiveness, and seller metrics.
Lazada: Similar to Shopee but with stricter content requirements. Audit listing quality scores (Lazada provides these in Seller Centre), image compliance, and attribute completeness. A complete listing compliance audit catches issues that suppress your visibility.
TikTok Shop: Content-driven conversion. Audit video quality, product showcase quality, and live stream performance. Traditional product page optimization matters less here — the buyer journey starts in a video, not a search result.
| Audit Area | Shopify | Shopee | Lazada | TikTok Shop |
|---|---|---|---|---|
| Page speed | Full control | No control | No control | No control |
| Product images | Full control | Full control | Full control | Full control |
| Checkout flow | Full control | No control | No control | No control |
| Trust signals | Full control | Seller metrics | Seller metrics | Seller metrics |
| Pricing display | Full control | Full control | Full control | Full control |
| Video content | Optional | Optional | Optional | Critical |
| Mobile UX | Full control | No control | No control | No control |
What Tools Help With Conversion Audits?
Use analytics for data, screen recording for behavior, and audit checklists for systematic coverage — no single tool does everything.
| Tool | Purpose | Cost |
|---|---|---|
| Google Analytics 4 | Funnel analysis, page performance | Free |
| Google PageSpeed Insights | Page speed scoring | Free |
| Hotjar or Microsoft Clarity | Heatmaps, session recordings | Free tier available |
| Baymard Institute benchmarks | Checkout UX standards | Paid research |
| Shopee/Lazada Seller Centre | Marketplace conversion data | Free with seller account |
| TaskForce | Automated listing compliance audits across channels | Contact for pricing |
The minimum toolkit: Google Analytics for funnel data, PageSpeed Insights for speed, and a spreadsheet for tracking findings and fixes. You do not need expensive tools to run a useful conversion audit.
What Are Common Conversion Killers in Ecommerce?
The top five conversion killers — in order of impact — are slow page speed, surprise costs at checkout, poor product images, mandatory account creation, and missing social proof.
These five issues account for the majority of conversion loss across ecommerce stores. If your audit reveals any of these, fix them before anything else:
1. Page speed over 3 seconds. Every additional second of load time reduces conversion by approximately 7%. This is the most universal and most fixable issue.
2. Surprise costs at checkout. Shipping, tax, or handling fees that appear for the first time during checkout cause 48% of cart abandonment per Baymard Institute.
3. Poor product images. Fewer than 5 images, low resolution, no lifestyle shots, no zoom. Buyers cannot touch the product online — images are the substitute.
4. Mandatory account creation. Forcing registration before purchase adds a step that 24% of abandoning buyers cite as the reason they left.
5. No reviews or ratings. First-time buyers rely on social proof. A product with zero reviews converts significantly lower than the same product with even 5-10 reviews.
How Often Should You Run a Conversion Audit?
Run a full audit quarterly, a focused audit monthly on your top 20 pages, and continuous monitoring on checkout completion rate and page speed.
| Audit Type | Frequency | Scope | Time Required |
|---|---|---|---|
| Full conversion audit | Quarterly | All pages, all channels | 8-16 hours |
| Top-page focused audit | Monthly | Top 20 pages by traffic | 2-4 hours |
| Checkout monitoring | Weekly | Checkout completion rate | 30 minutes |
| Page speed check | Weekly | Top landing pages | 15 minutes |
| Post-campaign audit | After each campaign | Campaign landing pages | 2-4 hours |
The quarterly full audit catches systemic issues. The monthly focused audit keeps your highest-traffic pages optimized. Weekly monitoring catches sudden drops before they compound.
For teams running daily operations across multiple channels, building conversion checks into your ecommerce daily operations checklist ensures nothing gets missed.
Frequently Asked Questions
What is a good ecommerce conversion rate?
It depends on your channel and category. Shopify store averages range from 1.5% to 3.5%. Marketplace conversion rates (Shopee, Lazada) tend to be higher (3-8%) because marketplace visitors have stronger purchase intent. Compare against your own historical data first, then category benchmarks.
How long does a conversion audit take?
A thorough first-time audit takes 8-16 hours for a single channel. Subsequent quarterly audits take 4-8 hours because you already have the baseline. Multi-channel sellers should budget 2-3 days for a comprehensive audit across all channels.
Can I audit marketplace conversion if I do not control the checkout?
Yes, but your audit scope is different. On Shopee and Lazada, focus on listing-level conversion: impressions to clicks (title and main image quality) and clicks to orders (product page quality, pricing, reviews). You cannot change the checkout flow, but you can optimize everything before it.
Should I A/B test conversion changes?
Yes, when possible. Shopify supports A/B testing through apps. Marketplaces do not offer native A/B testing, but you can run sequential tests (change one element, measure for two weeks, compare to the prior two weeks). Always change one variable at a time.
What is the fastest conversion win?
Page speed. Compressing images and enabling lazy loading can be done in an afternoon and typically produces measurable results within a week. No design changes, no copywriting, no testing — just make the page load faster.
Keep Reading
- Ecommerce CRO Checklist — The complete conversion rate optimization checklist
- Ecommerce Audit Guide — The broader audit covering operations, SEO, and UX
- Ecommerce Compliance Guide — Marketplace listing compliance that affects conversion
- Shopify SEO Audit — SEO-specific audit for Shopify stores
Take the Next Step
A conversion audit tells you where you are losing sales. Fixing those leaks is an operations challenge — it requires consistent execution across product pages, checkout flows, and marketplace listings. If you want to see where your overall operations stand, take the Ecommerce Operations Scorecard. It takes 2 minutes and shows you exactly what to fix first.
Find out what your operation is missing
Answer 10 questions. Get your ops score. Takes 2 minutes.
Take the Scorecard